Runs
Recorded runs capture the results from your test runs.
If you haven't set up your project to record read here.
Run Details
On navigating to a specific run, you are presented with the Run Details page. This page consists of a common header and four tabbed sub-pages, Overview, Test Results, Specs, and Errors.
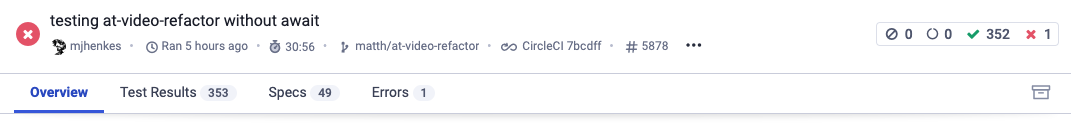
Run header
At the left side of the header is important metadata about the run, including git author and branch if available, run time and duration, CI data and more. Clicking on the three dots to the right of this section displays additional metadata, including browsers and operating systems used, the Cypress version, and what Smart Orchestration settings were active.
At the right of the header are a set of indicators showing the number of flaky, skipped, pending, passed, and failed tests in this run. Clicking any of these takes you to the Test Results tab with results filtered by the clicked status.
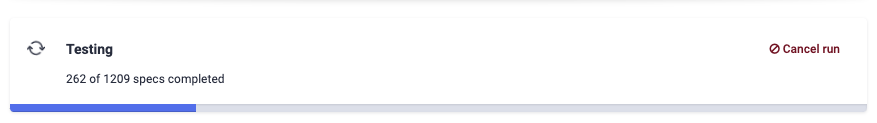
Run in progress panel
If the selected run is currently in progress, an additional panel will be shown under the Run Header with a progress indicator and an action link to cancel the run.
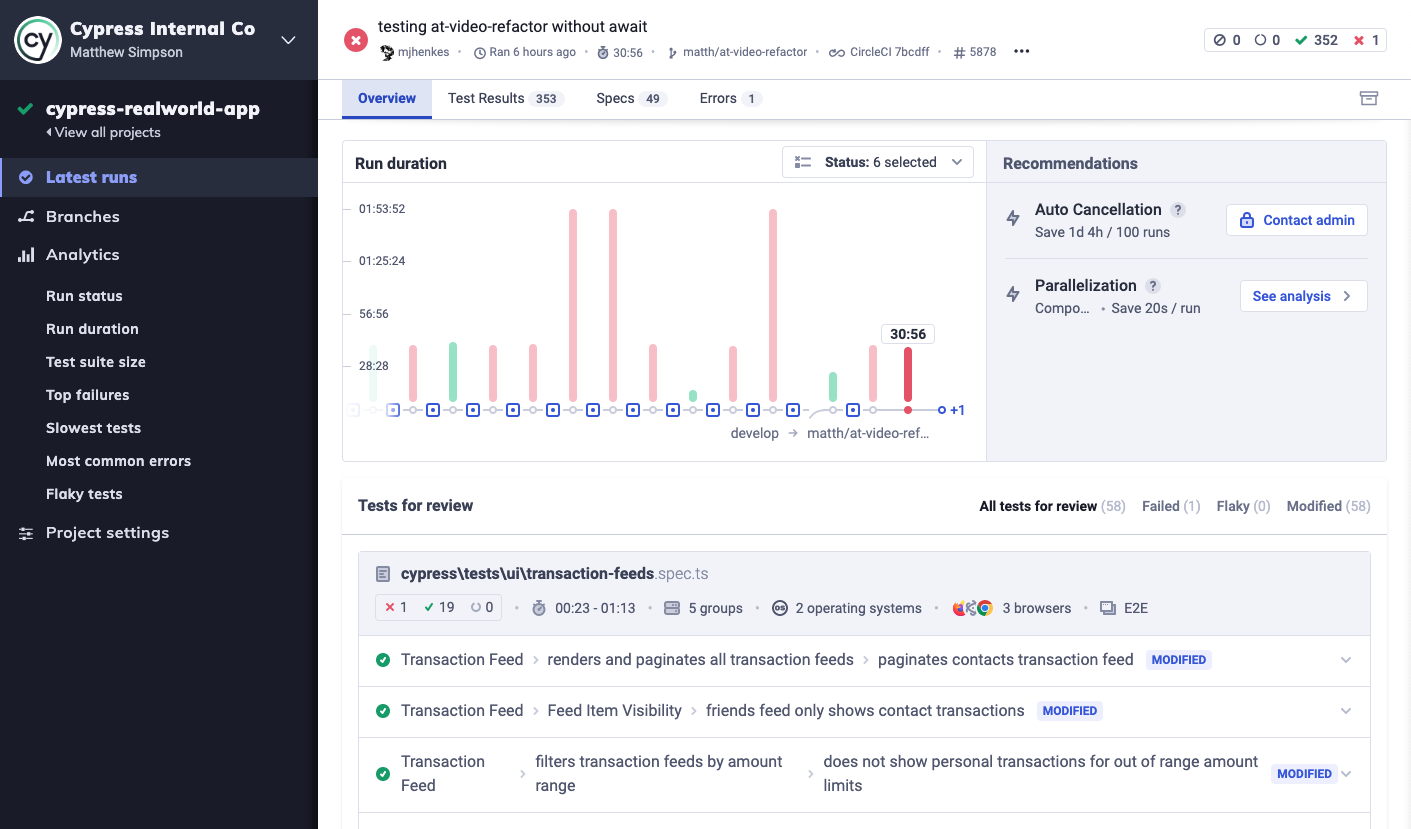
Overview tab
By default the Run Details page will be open to the Overview tab. Here you can see the run metrics we consider most critical.
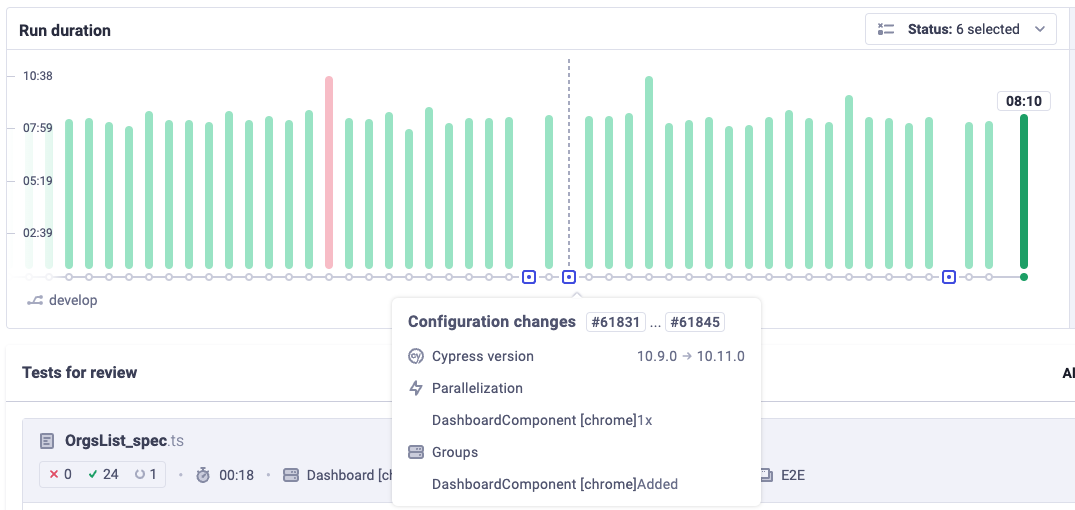
Run duration
This graph visualizes how long your tests took to run compared to previous runs, with the currently selected run highlighted. Run status is indicated by the color of the bars, which may be filtered by status with the dropdown to the top right of that graph. Hovering over a run displays a popover with more information.
At the bottom of the run duration graph you may see one or more blue boxes. These represent points in time when configuration settings were changed, possibly impacting test performance. Hovering over them reveals the specific changes made.
Recommendations
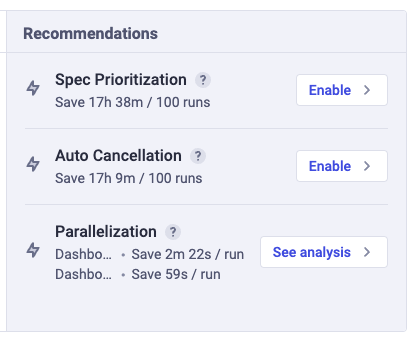
To the right of the run duration graph you may see a box with our recommendations for improving the performance of your test suite. Our Smart Orchestration features can help you run fewer, more relevant, and faster tests, depending on the details of your test suite.
The algorithm we use to calculate the details of these recommendations is a sophisticated and quite detailed model of your test suite, but fundamentally we look at up to 100 of your most recent tests and simulate what those test runs would have looked like with different Smart Orchestration configurations. From there we calculate a figure totalling the differences in duration between the simulated tests and the actual tests as they happened.
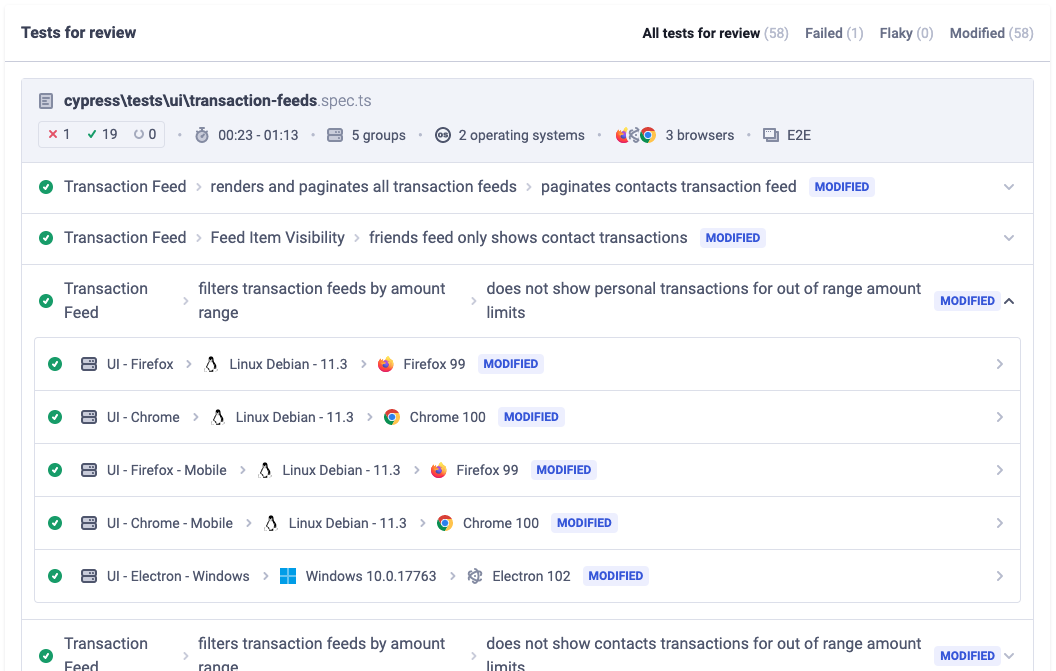
Tests for Review
The Tests for Review panel consolidates disparate test results into a single view, focusing attention on the specs producing the most relevant results. It shows Failed, Flaky and Modified tests broken down by spec, with easy access to run artefacts, and a badge clearly indicating the reason the result was considered notable.
Clicking on a specific test opens the test detail sidebar.
Test Results tab
On the Test Results tab, detailed results for the entire test run can be browsed and examined. At the top of the page are dropdowns for you to sort and filter results by a wide range of metrics.
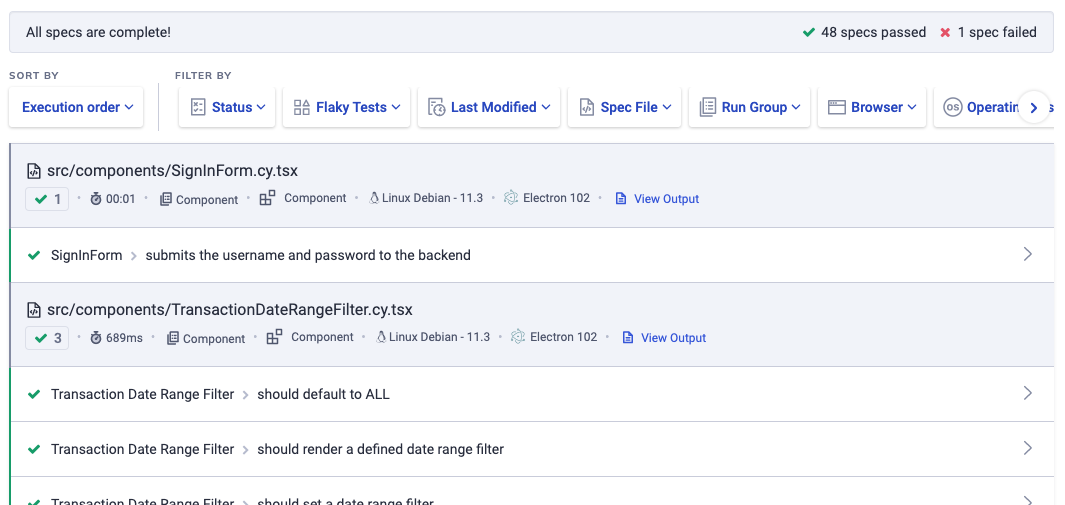
Specs tab
Another way to look at your run is by "zooming out" to the spec file level, which is the purpose of the Specs tab. This tab lets you view spec results collected into run groups, focusing either on run order, spec duration or parallelization. You can switch between these views using the Views button bar in the top right.
In all of these views, spec results may be clicked to open those tests in the Test Results tab.

Timeline View
The Timeline View charts your spec files as they ran relative to each other. This is especially helpful when you want to visualize how your tests ran in parallel.
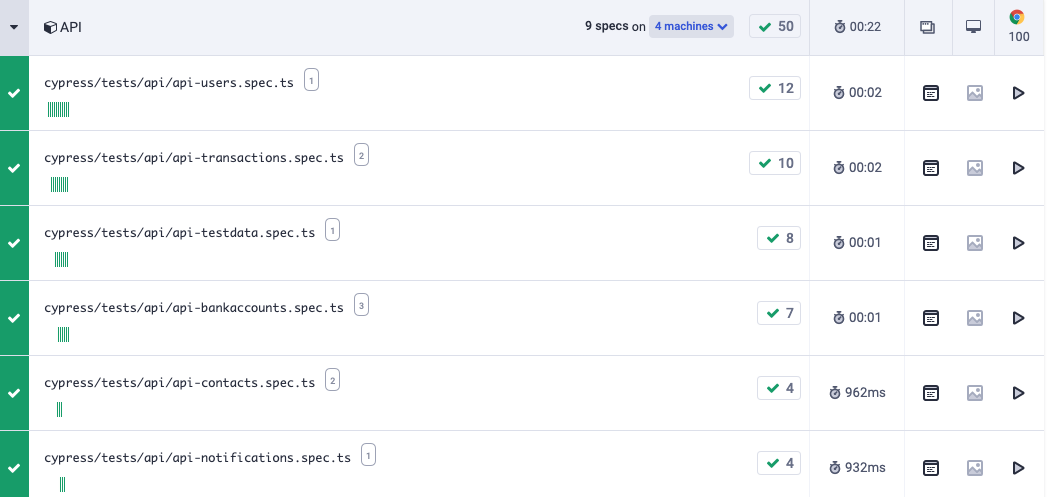
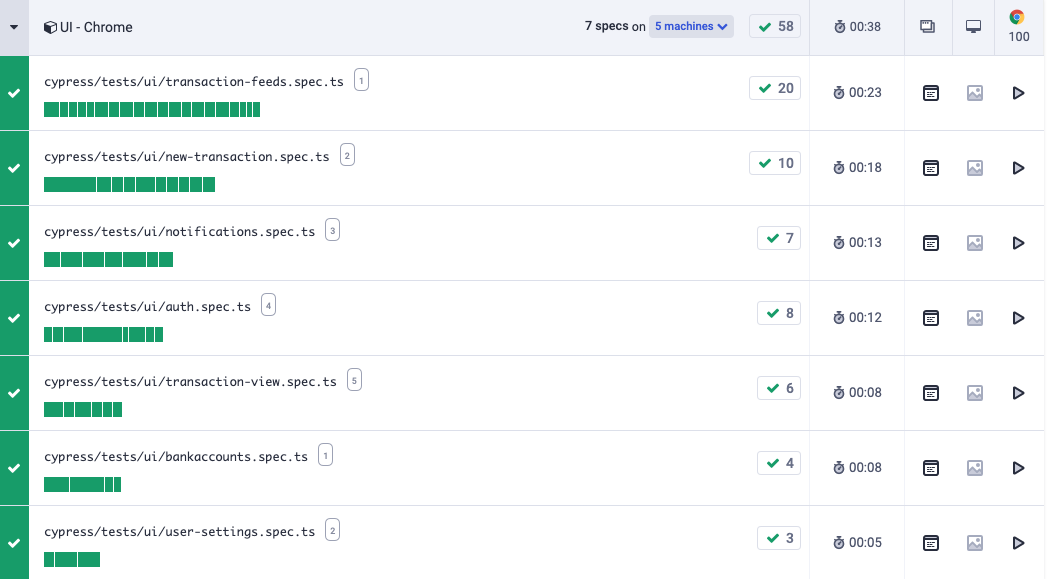
Bar Chart View
The Bar Chart View charts the lengths of each spec file. This view is helpful to determine which spec files are using up a lot of run time and could be split up or simplified.
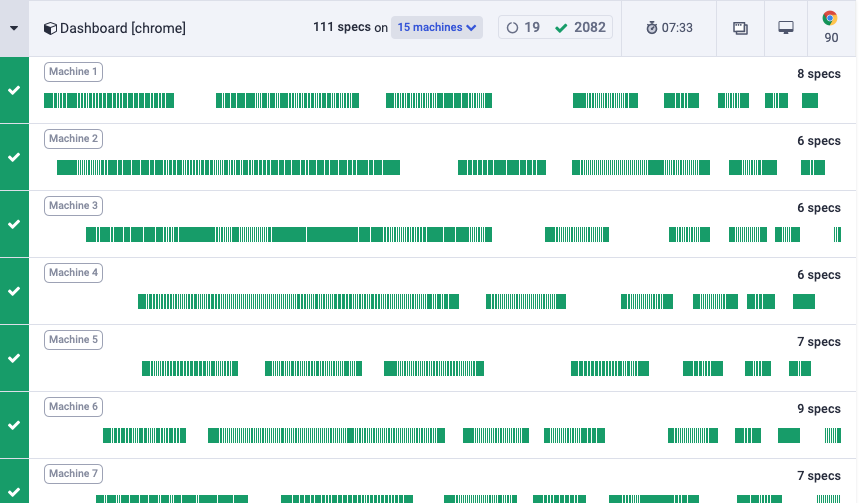
Machines View
If your tests are parallelized, the Machines View shows which and how many specs were run on each parallel process. This view lets you see how work is being distributed, and provides hard data for decisions about increasing or decreasing your CI parallelization capacity.
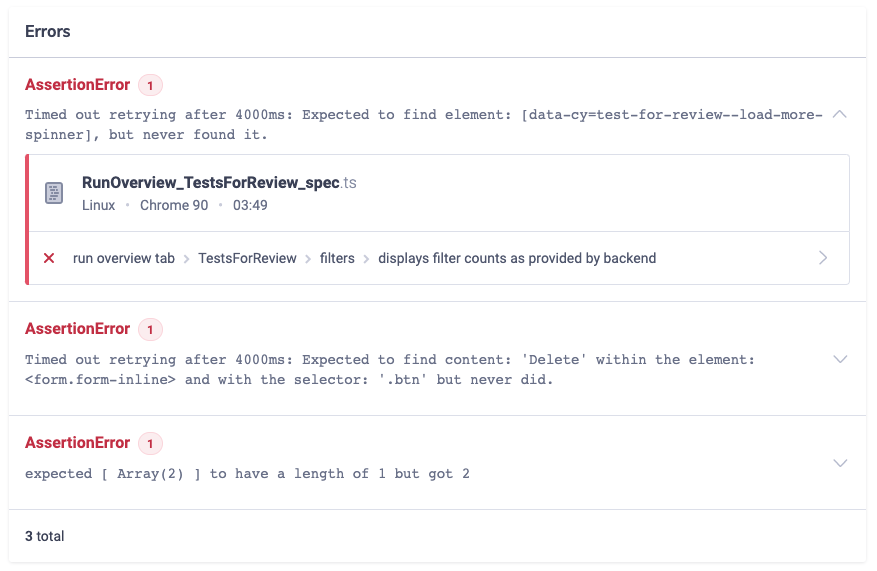
Errors tab
The Errors tab simply aggregates any errors thrown during tests in this run. Expanding specific errors gives more information and a link through to the test detail sidebar.
Test detail sidebar
Every test in the run has all its details surfaced in a special sidebar. This sidebar may contain all or fewer of the sections detailed below. In addition it may also contain details of runtime environment, failure and flake rates over time, performance breakdowns, listings of the test code itself, and more.
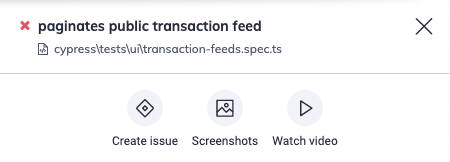
Header
Contains the title of the failed test, and the spec it's located in. May also have labels indicating test status or other pertinent information, and shortcuts to raise tickets on integrated PM systems or view artifacts.
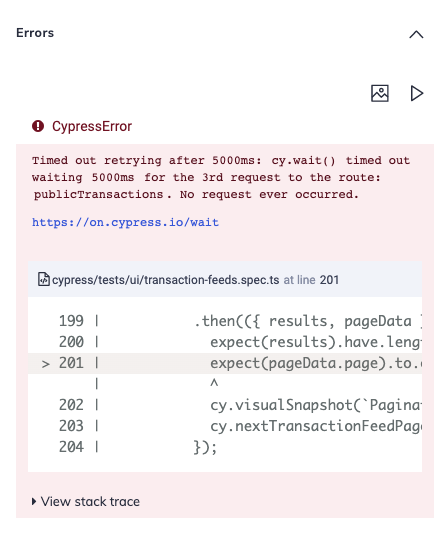
Attempts and errors
Stack traces, error message, and point-of-failure code frames for each attempt of a test.
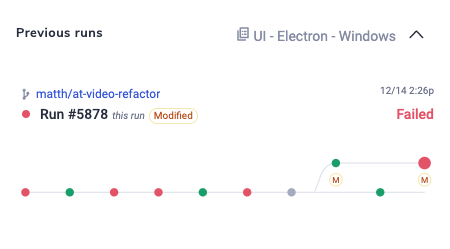
Previous runs
A graphical history of previous runs of this test, indicating failures and successes on the current branch.
Artifacts
Screenshots,
videos and CI logs generated by
this test. Both screenshots taken during failures and screenshots taken using
the cy.screenshot() command will show up here.
Video can be downloaded.
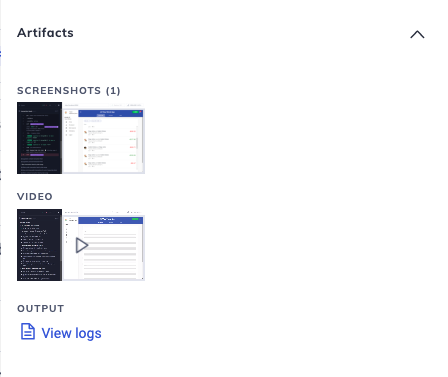
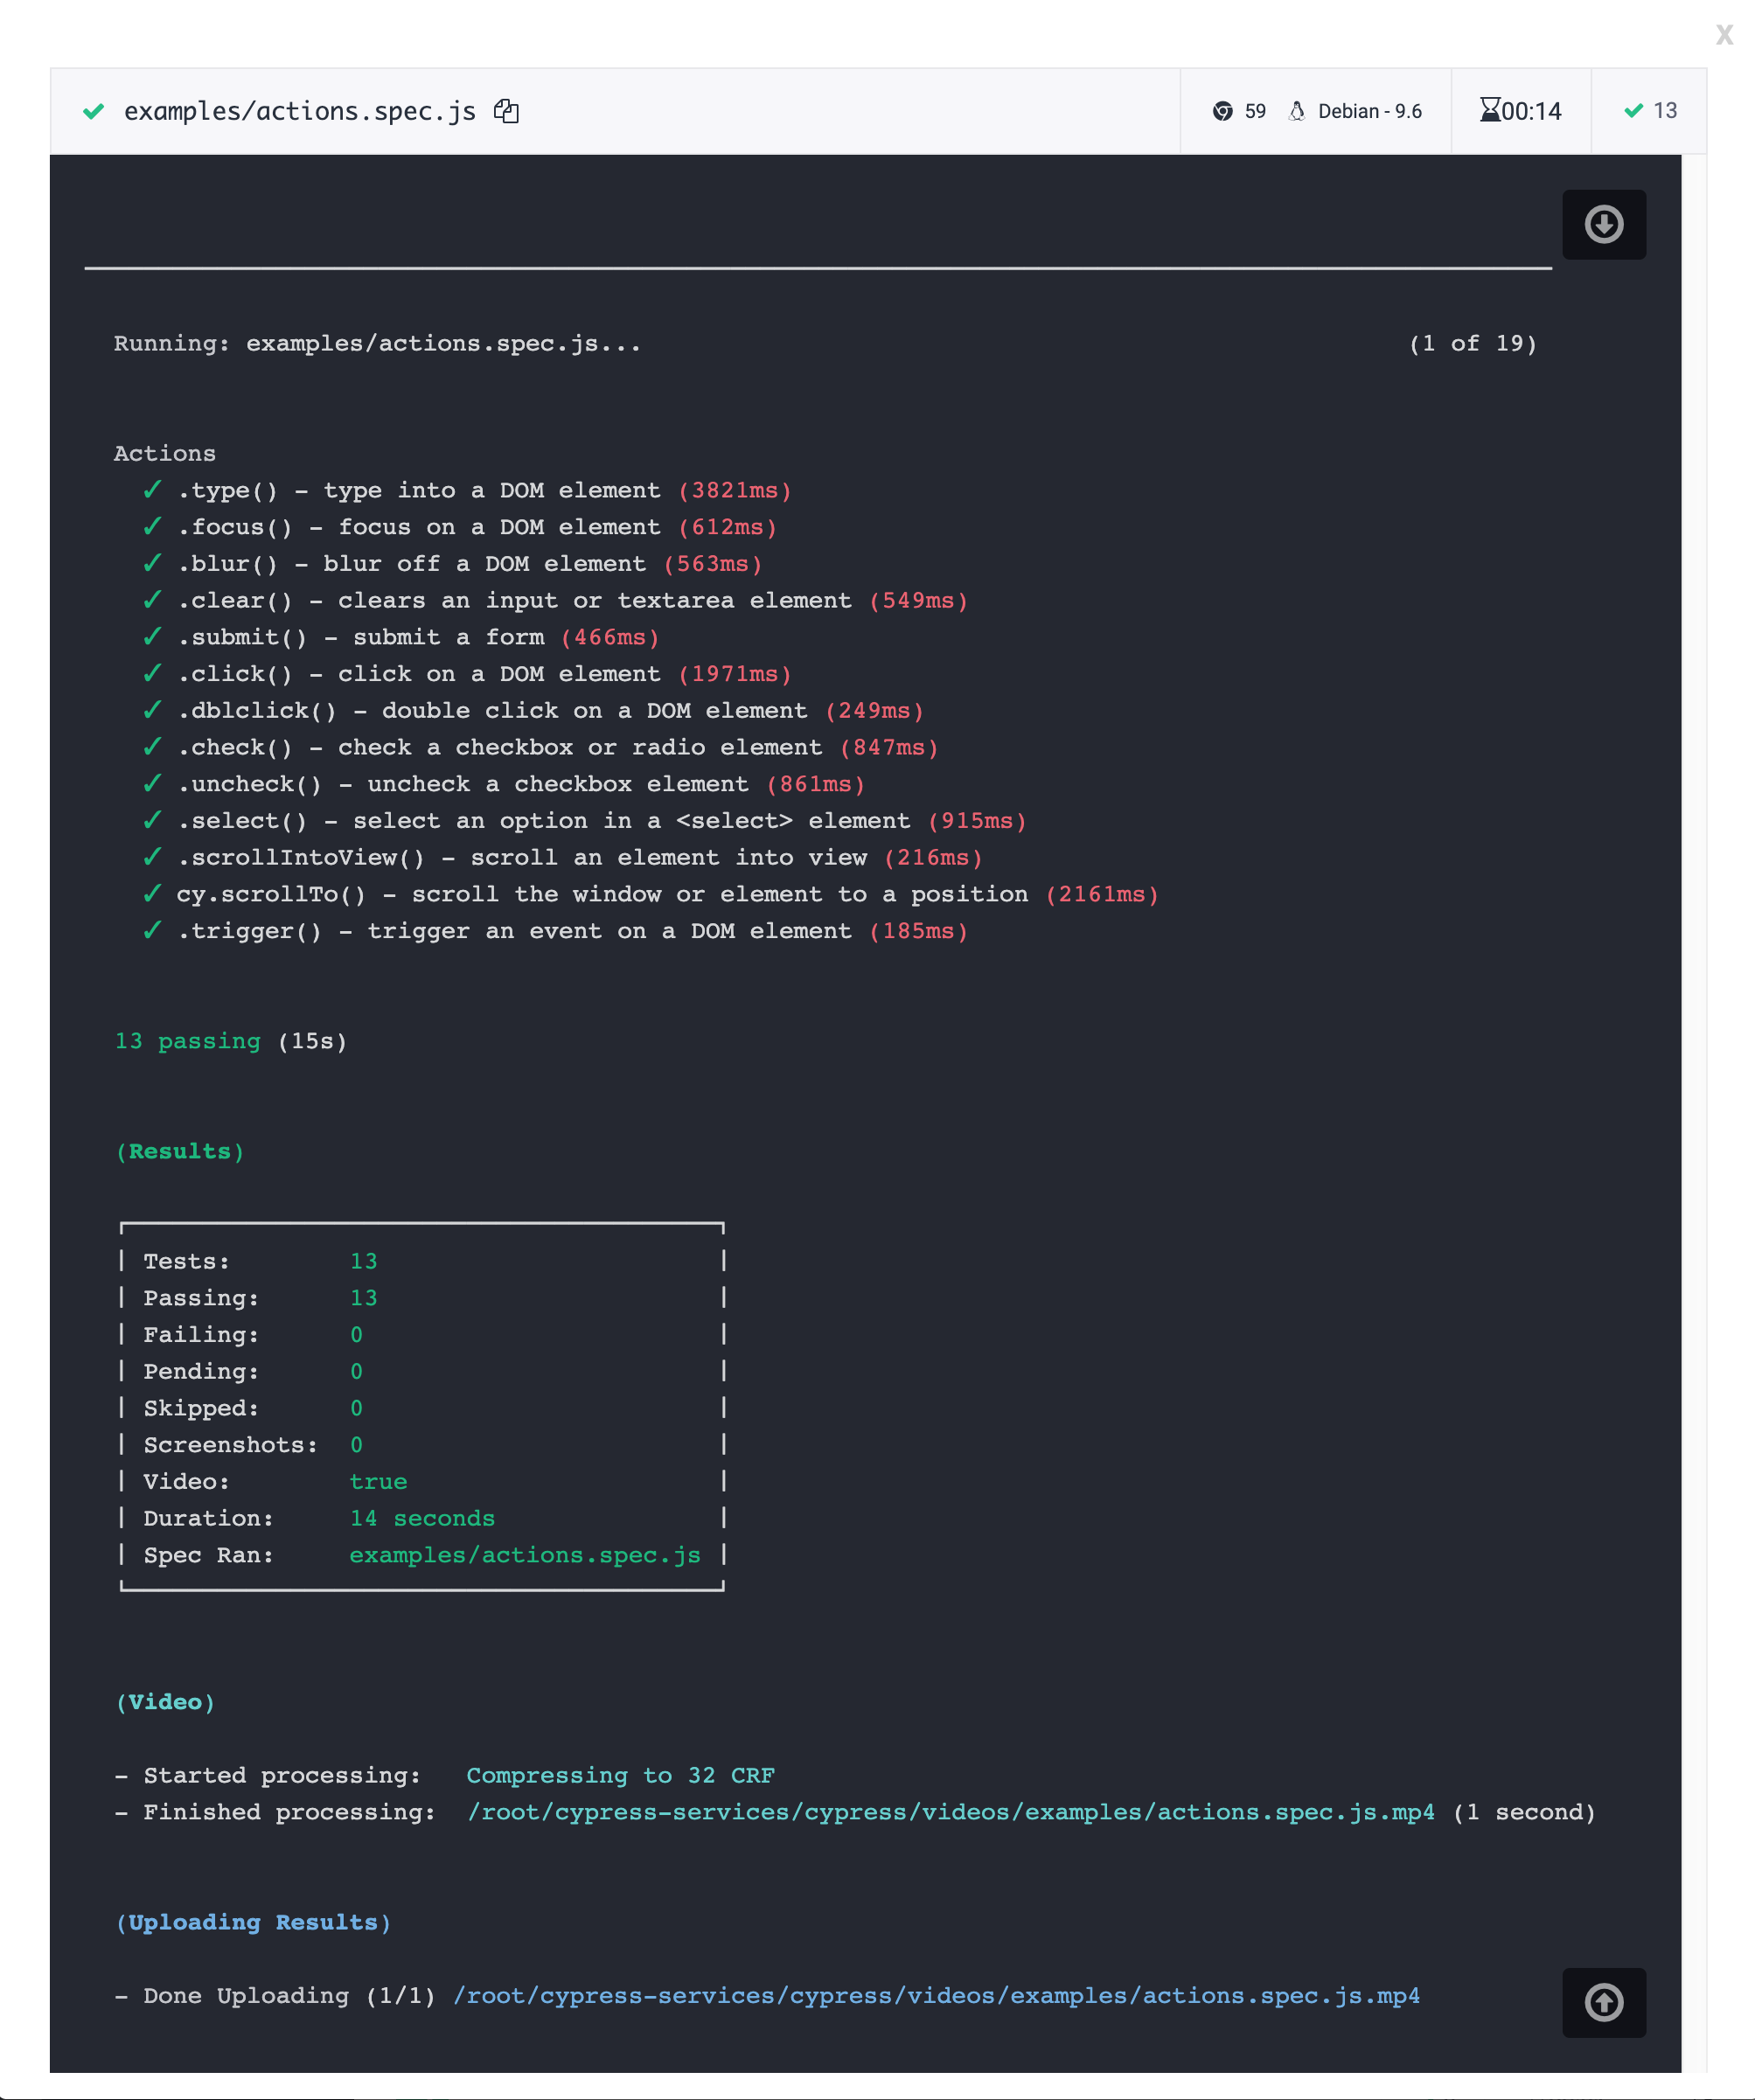
CI logs from the Cypress standard output include details and summaries of your
tests for each spec file based on the reporter you
have set. By default it is the spec reporter.
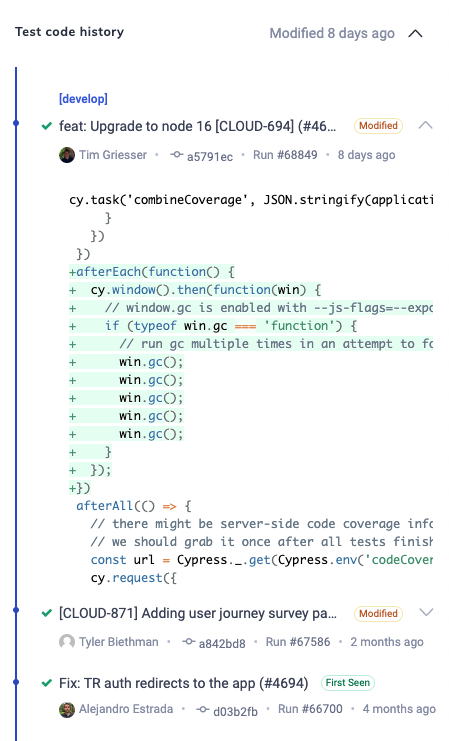
Test Code History
Shows git commits that included changes to the current test, providing insights into the development of this test, helping to diagnose test failures, and track down regressions. Expanding a specific commit shows the diff at that point in time.
Note that the diff is based on the state of the code after transpilation, since we are not currently collecting source maps.
Run cancellation
You can cancel a run currently in progress from Cypress Cloud. Runs can only be canceled by members of the project.
To cancel a run
- Click on a run in progress from the run list
- Click on Cancel run in the upper-right corner of the run details page
- Click Yes, cancel this run to confirm. Note: this cannot be undone
What happens when a run is canceled?
-
The run status will update to canceled.
-
A message will appear on the run details page showing the time of cancellation and the user that canceled the run.
-
The run will display as Canceled in the associated GitHub pull request if GitHub Integration is enabled.
-
Any tests recorded to completion will be available to view in the run details page.
-
Any tests recorded to completion will still count towards your monthly test results limit.
-
If you have Analytics enabled, canceled runs will appear in the Runs over time chart.
-
Any incomplete calls to cypress run --record for the run will be marked as canceled and not run.
-
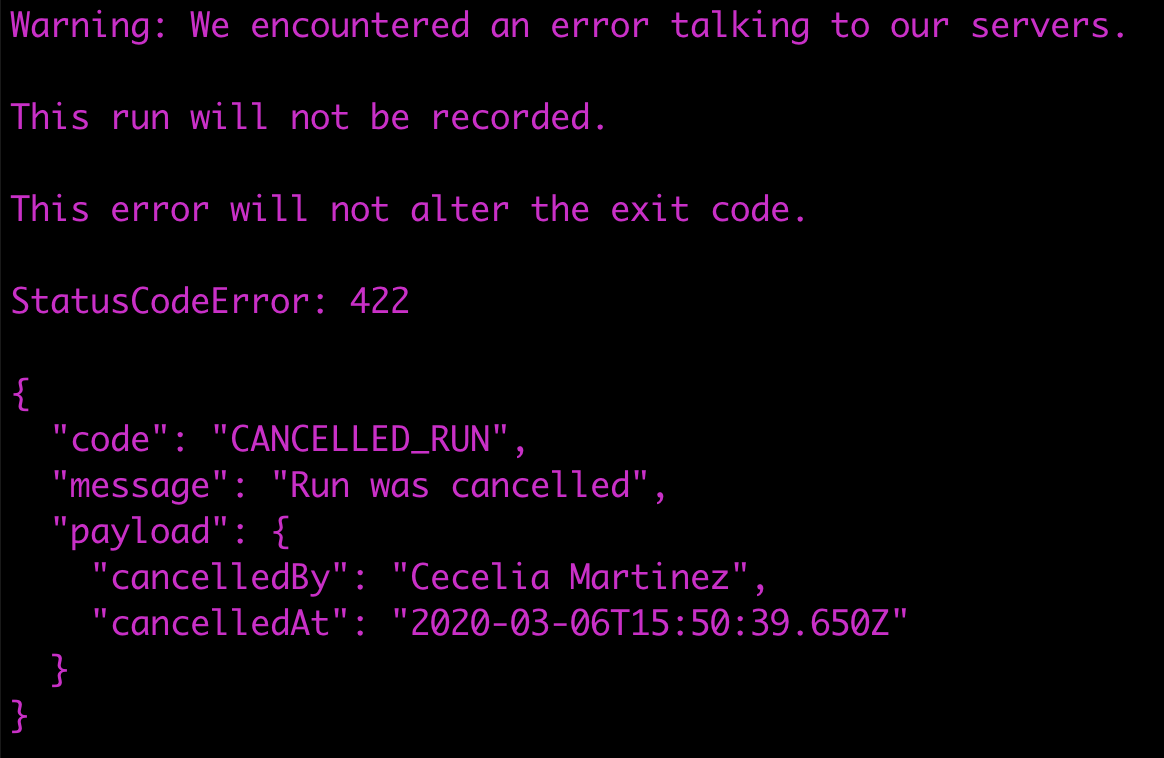
Any existing calls to cypress run --record for the run will exit with an error like below.
Archive run
Runs that have been canceled or are in an errored state can be archived from Cypress Cloud.
To archive a run
- In the cancellation or error message, click Archive this run.

What happens when a run is archived?
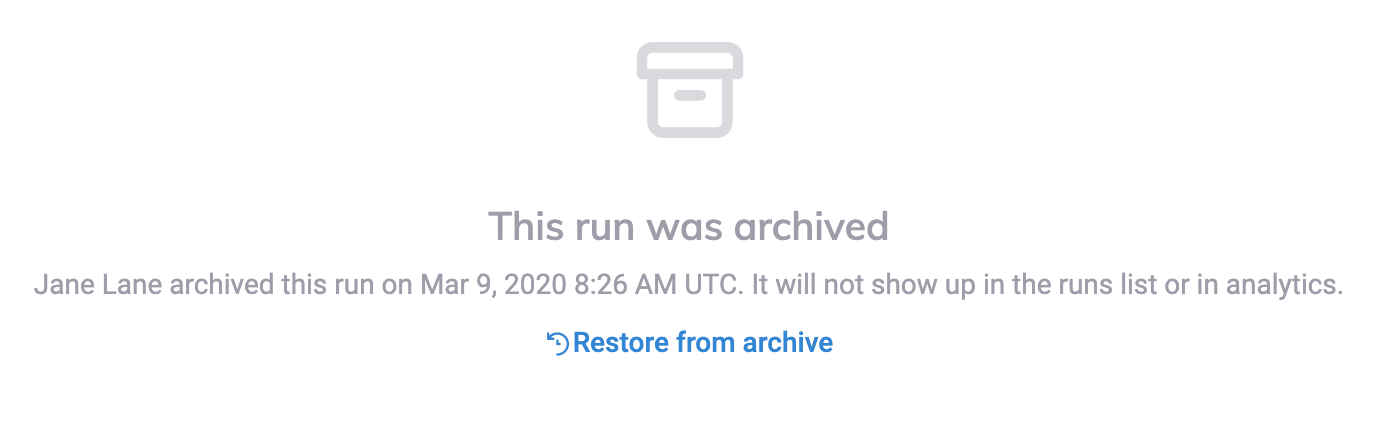
- The archived run will no longer display in the runs list or Analytics reporting.
- Archived runs can be accessed by the URL to that run. The format is:
https://cloud.cypress.io/projects/{project ID}/runs/{run number} - Any tests recorded to Cypress Cloud will still count towards your monthly test results limit, even when it has been archived.
To restore an archived run
- Visit the archived run. The archived run can be accessed by the URL of the
run. The format is:
https://cloud.cypress.io/projects/{project ID}/runs/{run number} - Click Restore from archive
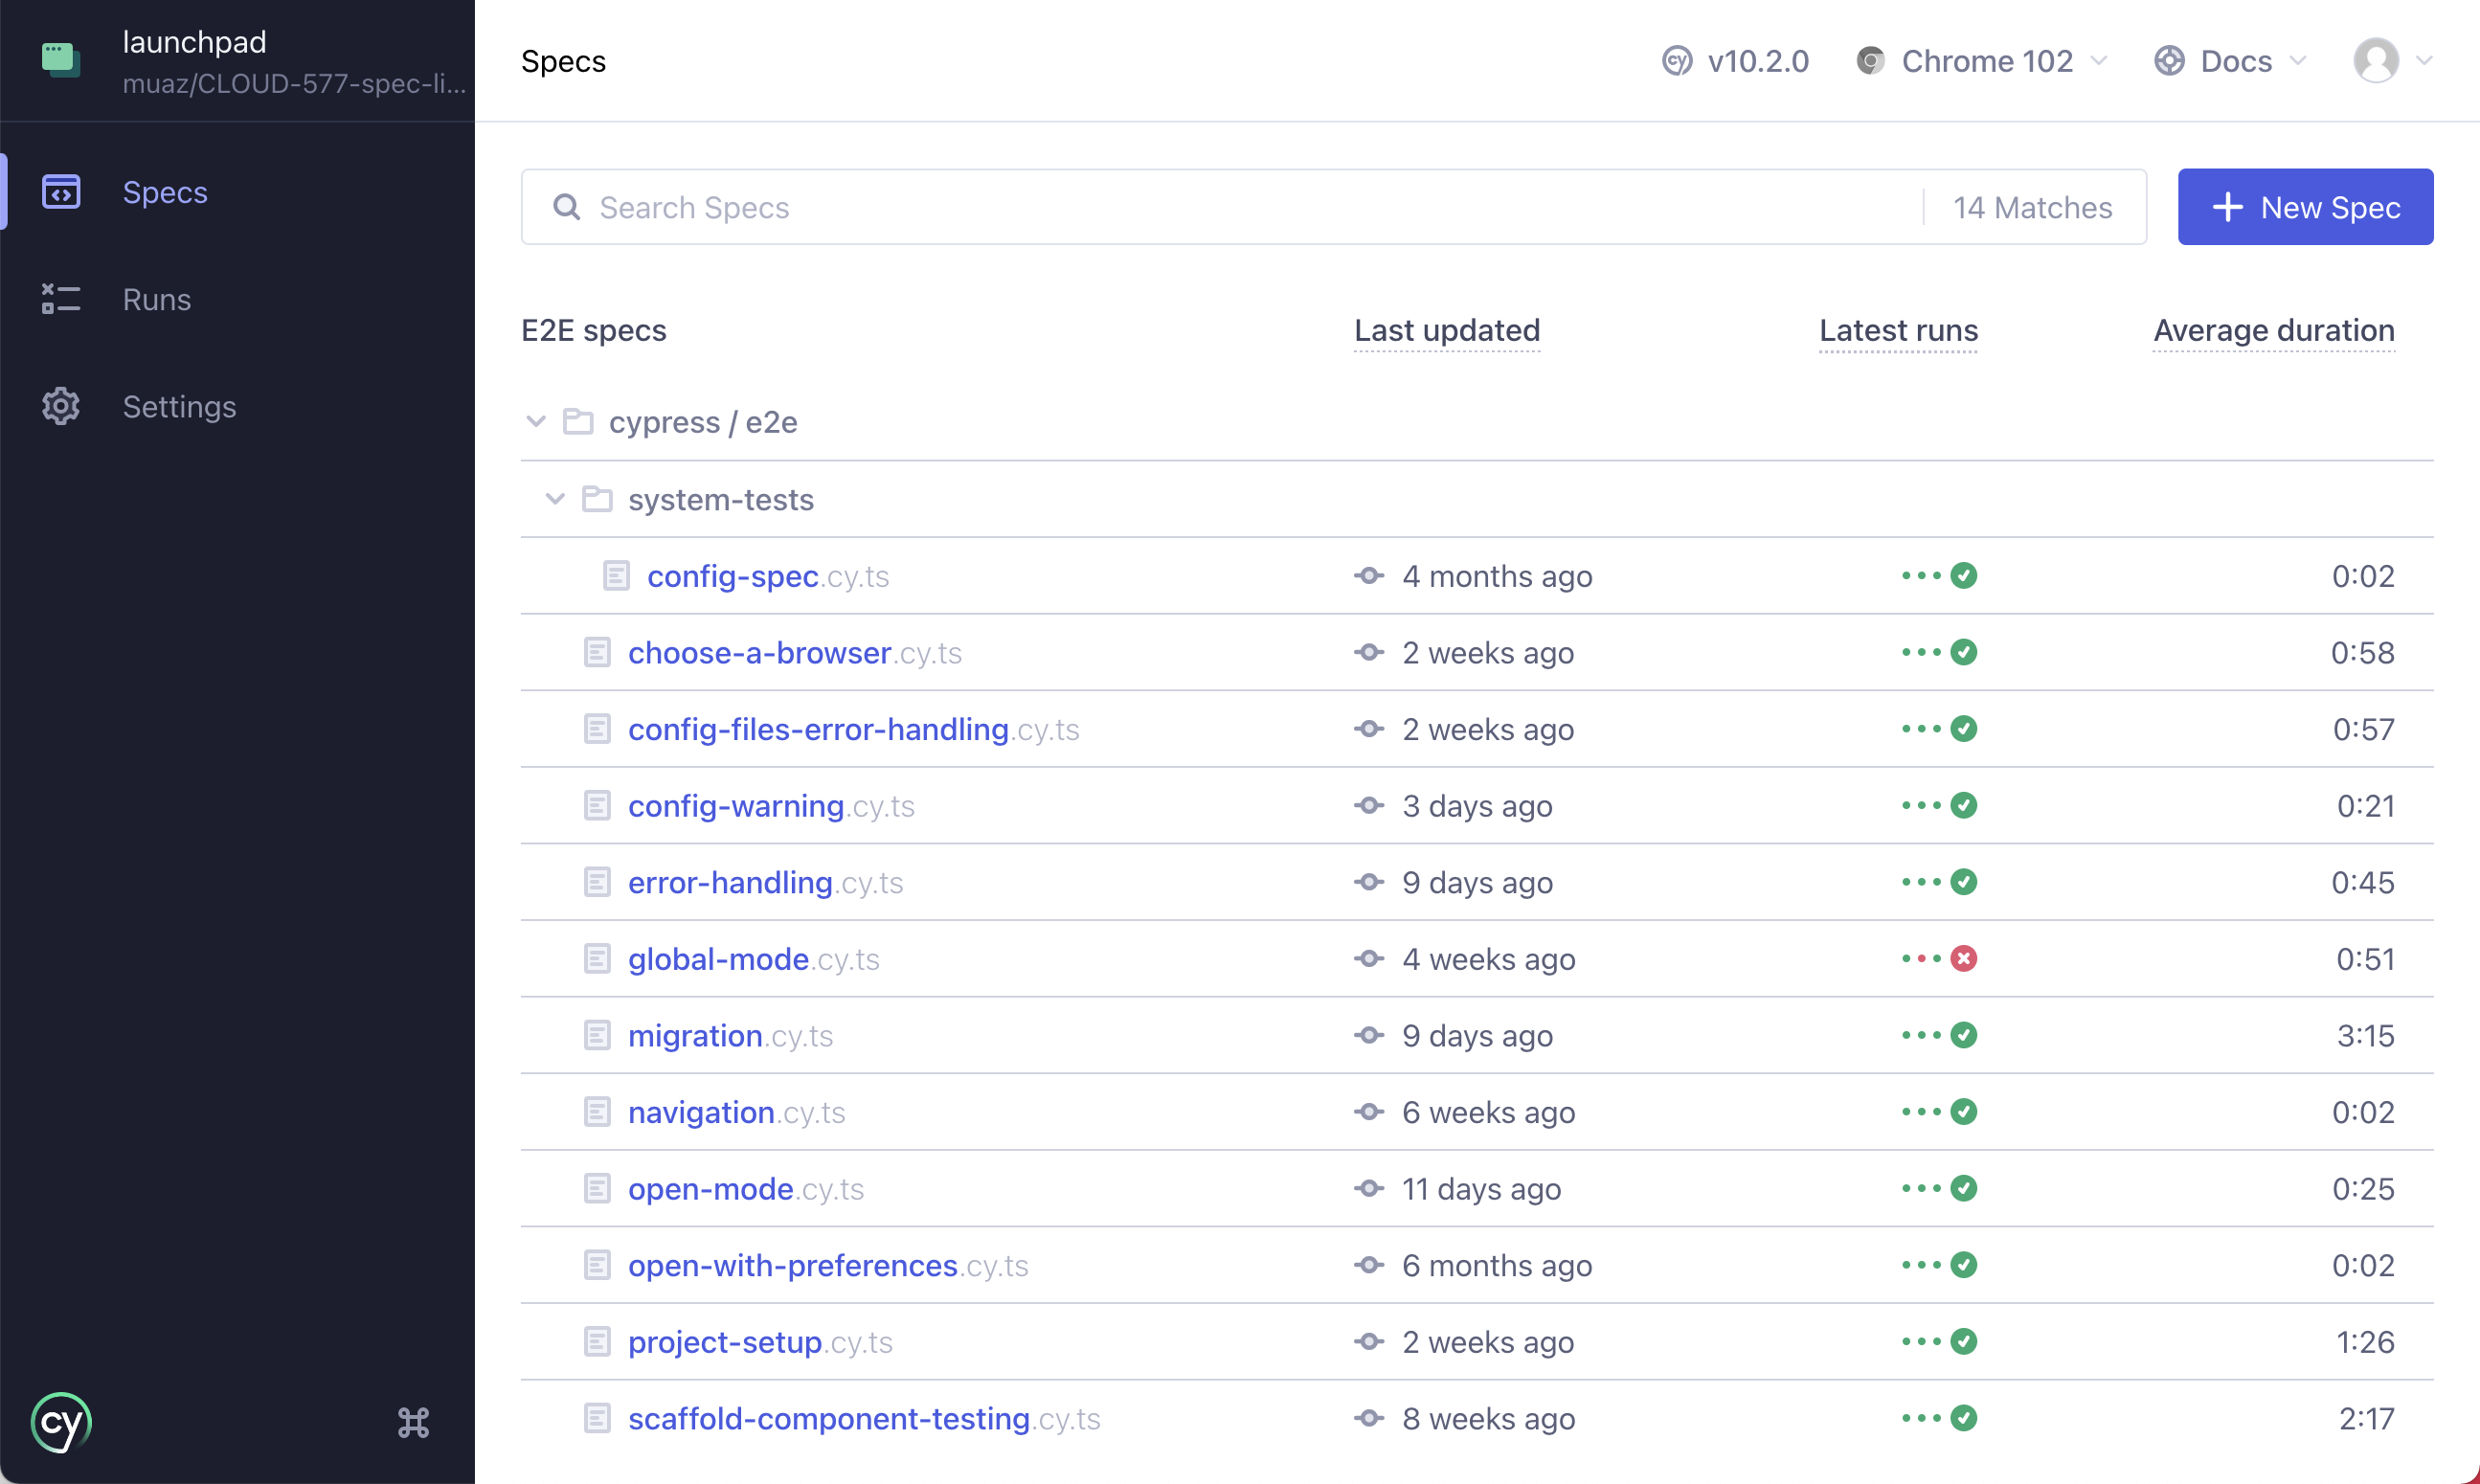
Cypress App
For even more visibility into your test results, information about recent runs is surfaced in the Cypress app. Aggregate results of your latest runs are shown in The Spec Explorer while more detailed information about specific runs can be found on the Project Runs screen.